Explore Our Demo Library
See what Gemini Enterprise can do for you
Gemini Enterprise turns your mission critical business data into AI-consumable knowledge to accelerate decision-making . Take a look at over a dozen examples of live in-app examples below.

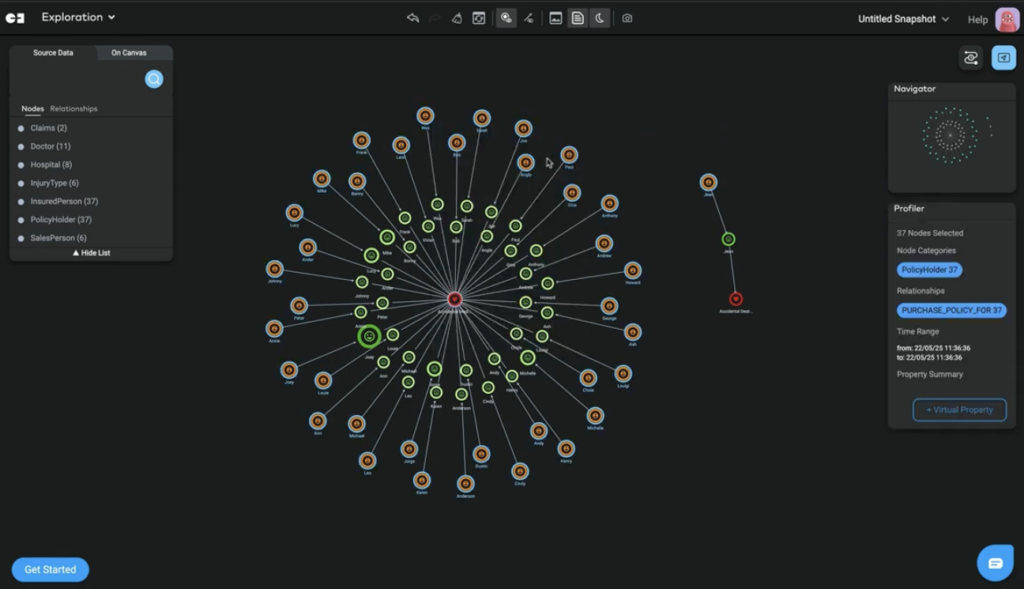
Insurance Fraud
A mid-size multi-state health insurance company runs fraud detection algorithms and exposes a fraud ring run by doctors and an insurance salesman at one specific clinic.

Supply Chain Management
A leading brand of video projectors is monitoring its global supply chain with graph technology. But there’s something odd with the parts coming from Australia.

Video Game Recommendation
A video game store wants to send personalized recommendations to every customer. Here’s how they built a recommendation engine with graph.

Movies, Directors, and Genres
A graph of the top directors, their movies, and genres. But which director has succeeded in all of the genres?

Cyber Attack Investigation
A security team at a Fortune 500 firm is investigating an attack on their network. Graphing the data set reveals several botnets with malware and attacks clustered among various IP addresses.

Olympic Games
A graph of data from the past Summer and Winter Olympics reveals which athletes participated in various events and in which city. But why is there an ice hockey event in the middle of summer?

Agriculture
Farmers around the world need to know what crops complement each other to reduce pests and increase yield. Here’s why tomatoes are simply the best.

Startup Founders
A startup founder is looking for contacts to get an introduction to a targeted investor. A graph of LinkedIn, Crunchbase, and Forbes data points the way.

E-commerce Fraud
The fraud team at a top e-commerce retailer notices some odd gift card purchases. Here’s how they opened an investigation and started their analysis.

World Health Organization
The graph of a global data set shows the World Health Organization the correlation between government spending, water quality, sanitation, and public health.

Tracking COVID-19
Researchers are contact tracing a COVID outbreak in a cohort of 300 people. Graphing the data reveals it all goes back to a taxi driver in Taiwan.

Wine Recommendations
Who makes the best Châteauneuf-du-Pape? An analysis of thousands of vintages from hundreds of vineyards and critical ratings puts the best of the best front and center.

NBA Draft 2023
The Detroit Pistons looked to scout for talent for the upcoming NBA draft. How do they decide which players to re-sign – and how can they leverage alumni networks?

Top FIFA players
A graph of FIFA data showing top metrics for speed, strength, heading ability, and composure. We’d expect to see mostly strikers here, but other central positions are also revealed.

YouTube Success Secrets
We analyzed a data sample of popular YouTube videos, concentrating on those that gained over 1 million likes. That shows us the ideal length, language, and video size for your next big viral hit.