
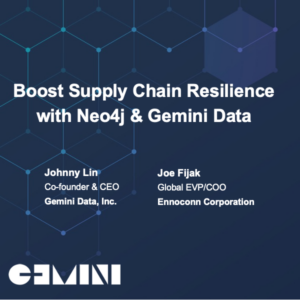
Key Strategies for Supply Chain Resilience
Learn how to recover from disruptions with the seven key elements of supply chain resilience.


Learn how to recover from disruptions with the seven key elements of supply chain resilience.
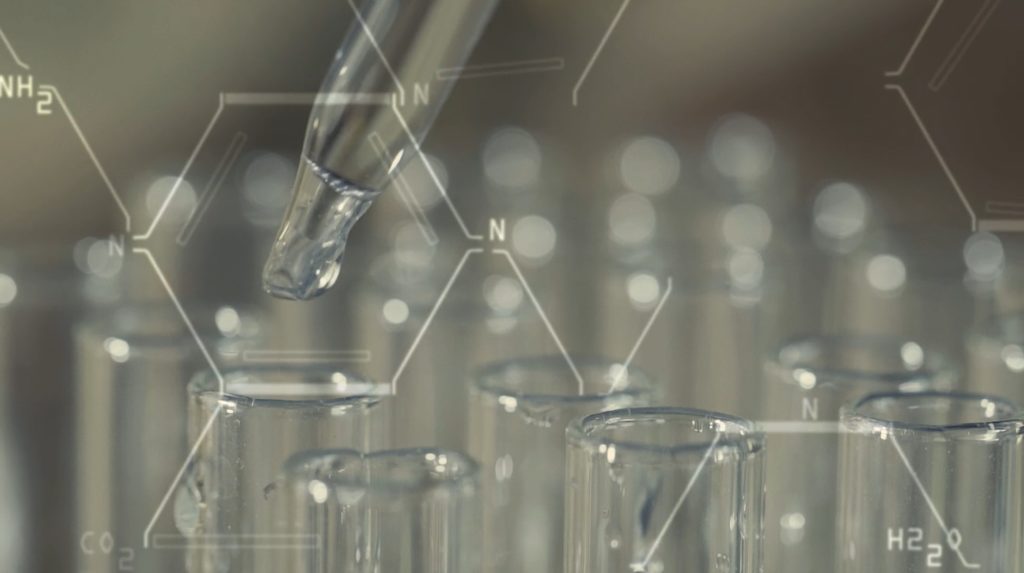
See how connecting the dots in diverse data sources can capture the relationships among patients, diseases, treatments, and outcomes and lead the way for better clinical trials, more effective treatments, and healthier outcomes.

What you need to know to get through the next 18 months.

See how connecting the dots in diverse data sources can capture the relationships among patients, diseases, treatments, and outcomes and lead the way for better clinical trials, more effective treatments, and healthier outcomes.